In today’s digitally connected world, brand awareness driven by public relations, content marketing, and social media is more important to businesses than ever before. It’s not enough to simply perform these activities, you also have to set KPIs that reflect your business goals and track the performance with reliable metrics. Otherwise, you have no way of knowing if your efforts are working. Or which efforts aren’t working. But don’t be fooled, measuring these efforts is no easy task.
Brand awareness doesn’t happen in a vacuum — it’s the result of cross-functional collaboration across the marketing organization. Public relations, content marketing, and social media teams must work together to influence brand awareness, and that’s how we measure it.
At the end of every quarter, the content marketing team walks through our goals, metrics, takeaways, and action items for the next quarter. We don’t just look at metrics, we tie our metrics back to our goals for the quarter and discuss what we learned and the next steps to keep the momentum moving forward for the next quarter.
Read the post below to learn how we define brand awareness as well as how we focus our PR, content, and social media efforts to increase it.
Brand awareness is how familiar your target audience is with your brand. It is generally thought of as the first and most important step in the buying process — without awareness, consumers will not consider your brand for purchase.
Brand awareness is how familiar your target audience is with your brand, whereas brand perception is how the audience feels about your brand. Brand perception often takes into account criteria like customer service, quality, value, features, and the sales process. If your customers perceive you positively and believe your brand is trustworthy, they’re much more likely to continue engaging with you.
Brand recall is also known as “top-of-mind awareness.” It’s a measure of how likely a customer is to remember your brand without any leading information. The more likely a person is to remember your brand, the more likely it is that they’ll talk about it, recommend it, and lean toward it when making a purchasing decision.
We look at total coverage each quarter broken down by feature articles, bylines, mentions, and syndicated coverage. This helps us track the type of coverage we are securing whether it’s a full feature article on Invoca or a byline we placed. We use Sprout Social to track coverage and social shares of every piece of coverage.
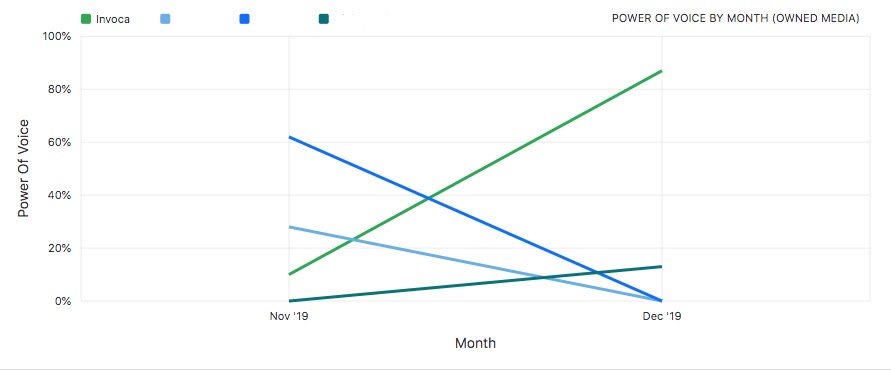
Share of voice is one of the most popular metrics in the public relations world. It’s defined as the percentage of coverage and conversations about your brand (news, blogs, and Twitter), relative to your competitors. SOV only measures the amount of coverage, and not the quality of coverage. To address this we look at the share of impressions – the percentage of the total number of people who were exposed to your company’s coverage, relative to your competitors. When you look at the two side by side you can measure the quality of coverage. If your company has a low SOV but high SOI this means you may not be securing as much coverage as your competitors, but you are securing articles in publications with high readership and better quality. We use Onclusive to measure SOV and calculate what they call Power of Voice, which is a metric that combines content relevance, publication authority, social media amplification, and sentiment, in a single measurement. This allows us to measure not just the volume of coverage, but to paint a more accurate picture of the influence of our media coverage.
Mentions include any time Invoca is mentioned in the media or on a blog that isn’t a byline or full article about Invoca. Mentions can include reporters and articles we pitched, or when a reporter includes our company in a broader story. We track the number of mentions over the quarters as a way to track awareness and buzz. Over the quarters our mentions have increased mainly due to relationships we have built with reporters, proprietary data reports we’ve published, and more joint activities with other tech companies.
Measuring message pull-through helps give us an idea of the quality of coverage. By landing key company messages in media coverage the company directly and indirectly benefits. If messages are not being picked up, it’s an indicator that either they are not resonating with media, or perhaps these aren’t the types of articles you want to be included in.

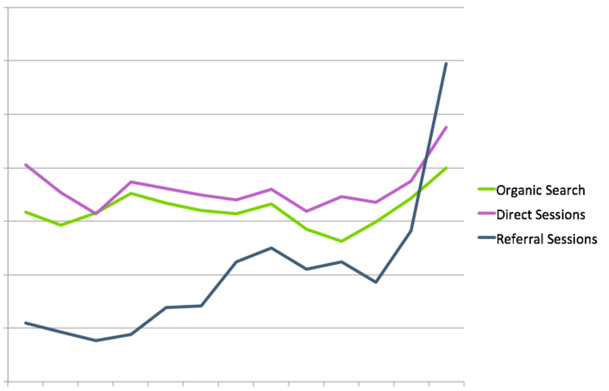
We use Google Analytics to analyze organic, direct, and referral traffic to our website. This gives us insight into whether or not our PR and social media efforts are driving people to our website. We can see spikes in our referral and organic traffic around the months we’ve had big PR announcements and lots of media hits. For example, we often see spikes from funding announcements, end-of-year announcements, and new product launches. When we look at the referral traffic, we can dig into exactly which articles are driving people to our website and the quality of those visits.
Branded search volume is another critical indicator of brand awareness. This metric shows how many people are literally searching for your brand by name. These searchers are some of your most valuable — they remember you and have a high intent to purchase your specific products or services.
We measure total and organic blog traffic every month and dig into the blog posts, promotions, and social referrals that drove the most traffic. We look at the organic and direct blog referral sources (LinkedIn, Facebook, direct, email, and organic) to discover the best sources driving visits and put more energy into promotion via those places. We also look at unique pageviews vs. pageviews so we can understand how many first-time visitors we’re driving to the site from each channel.
We look at the top content downloaded from the blog and the sources driving those conversions, whether it’s links within the blog posts or CTAs at the end. This gives us insight into the type of content that was downloaded the most and the best way to promote this content.
In addition, we look at the blogs that are driving our most valuable conversions: demo requests. We can then create similar types of blogs that move web visitors down the funnel and generate interest in our product.
Looking at the number of social shares as well as which social media sites the blog posts are being shared on helps us determine the best way to promote posts and get more insight into the more popular post topics. If a topic gets a lot of buzz on social, it’s usually a sign that we need to create more content around it.
Backlinks are a critical piece of brand awareness — they show that other sites are referencing you and your products or services. Strong backlinks not only bring in visitors from other websites, but they’re also a key ranking factor for search engines. More backlinks mean more traffic to your website, both from referrals and organic searches.
A great way to increase your backlinks is by guest posting on other websites and adding anchor text linking back to key webpages on your site.
Sometimes, you want to understand how popular your brand or products are at a macro level. To get this level of scale, we review Google Trends data. For the uninitiated, Google Trends is a website by Google that analyzes the popularity of top search queries in Google Search across various regions and languages. It uses graphs to compare the search volume of different queries over time.
Below is an example of how search volume for “call tracking” has grown since 2004:
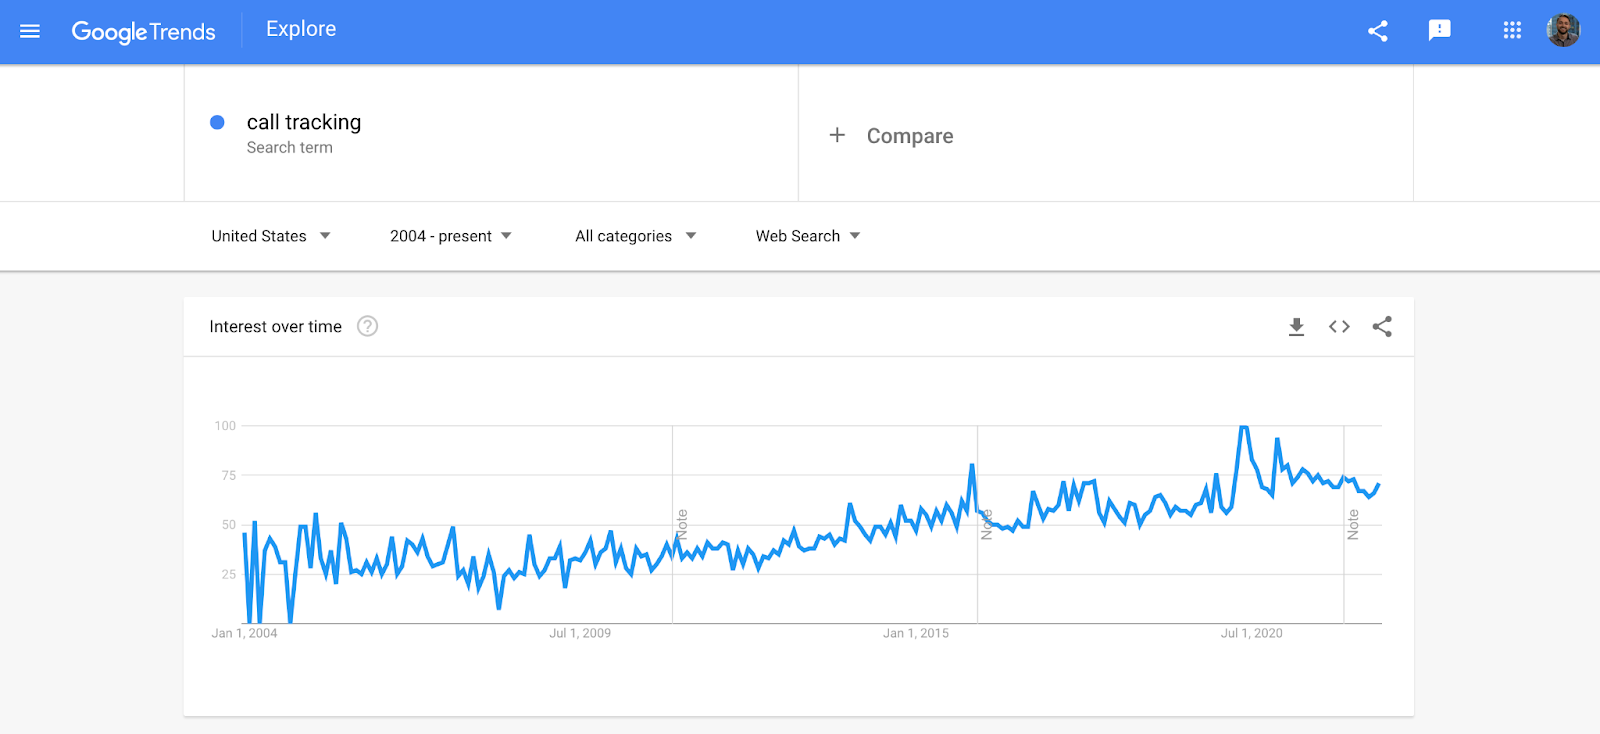
Google trends can give you a detailed view about how search volume for your product, services, or industry has changed over time and in which regions you’re most popular. For instance, you may see that brand awareness for one of your product lines is far higher than the others, or that there’s one geographic region where you’re more well known than others. This can help you adjust your strategy to ensure that you’re driving search awareness for your key products in the regions that matter most to you.
Social media listening is different than just monitoring social activity and responding to people engaging with your brand online. According to Sprout Social, social media listening requires that you analyze the conversations and trends happening not just around your brand, but around your industry as a whole, and use those insights to make better marketing decisions.
Social media listening helps you understand not just what people are saying about your brand, but why, where, and how these conversations are happening. This helps you get to the core of what people think of your brand, helping you optimize campaigns, improve content strategy and messaging, and outpace your competition. Here are the metrics you need to look at to inform your social listening strategy.
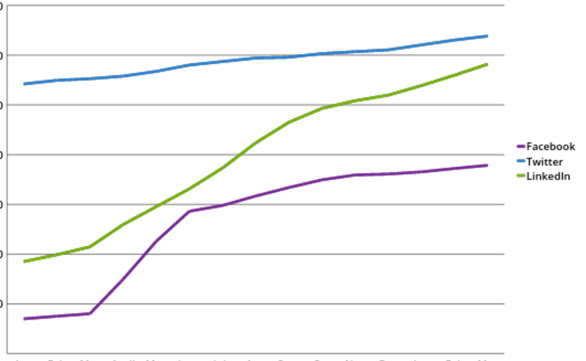
Invoca’s main social media channels are Facebook, LinkedIn, and Twitter. We look at how many followers increase over time. By comparing this to the activities going on — consistent posts, paid promotion, engaging influencers, and big announcements — we can determine our strategy moving forward for growing Invoca’s audience.
Engagement includes shares, likes, comments, etc. on Facebook, LinkedIn, and Twitter. We dig into the top-performing posts across all three channels. This helps us determine ways to tailor content for the different social channels and how to continue to increase engagement. We also use Sprout Social to help us measure the engagement our content is driving on social media.
Social media helps with brand awareness and it’s also a good avenue for driving people to your site. We focus on driving referral traffic from our social avenues and driving quality traffic. We dig into the top-performing posts that drive traffic to the Invoca website. We also look at the social platforms that drive the best traffic by looking at average session duration and bounce rate.
When a consumer comes straight to your site, rather than finding you on Google or through an ad, this is called “direct traffic.” An example is when, instead of running a Google search for “call tracking,” a consumer goes straight to invoca.com. High levels of direct traffic indicate high brand awareness and brand recall — your consumers know who you are and they’re coming directly to your website, without prompting.
We use Google Analytics to keep an eye on our direct traffic over time. If it’s growing at a consistent rate, we know that more consumers are becoming aware of our brand and our products.
A social conversion is when someone clicks on a link that leads them to a landing page for a gated content asset, webinar, or event. We measure the number of conversions, the social platform driving the conversions, and the type of content that is converting.
Don’t just measure your efforts for the sake of measuring — that doesn’t help your brand awareness. Look at your metrics for key takeaways that will help you reach your goals and deliver even better results over time. Use your metrics to communicate how your work directly impacts the bottom line, how you are driving leads and business value.
Employee advocacy is another key lever that can help you increase brand awareness. We use a tool called EveryoneSocial to improve employee advocacy and make it easy for employees across the organization to share social media content. The platform also has detailed metrics about which employees are getting the most “likes,” comments, and engagement, and gamifies the process. Additionally, we can see our overall reach and how many impressions we’re generating across the organization. By quantifying employee advocacy with the platform, we can see how much brand awareness our employees are generating.
Sometimes the metrics you capture from your marketing channels aren’t enough — you may want more granular data. To get these insights, you can ask your customers directly. This will provide a wealth of new information you can use to inform your marketing strategy.
When consumers have an especially good — or poor — experience with your brand, they’re likely to let others know about it on a review site. They may go to Google reviews or use an industry-specific review site, such as Yelp for restaurants, ZocDoc for healthcare, Angi for home services, or G2 for software. To keep tabs on all their reviews across the web, many companies use review management software.
Keeping a close eye on reviews can help you understand how your customers feel about your products. It can also help guide your decision-making so you can create a better experience for your customers, and a more positive brand perception.
Unlike the data sources above, surveys require effort on the part of your customers. To secure their participation, it’s best to offer something in return, whether it’s a discount, a coupon, or a chance to win a prize.
When you create your survey, it’s important to only ask questions that fulfill your end goal of measuring brand awareness — when you cut unnecessary questions, you’ll boost completion rates. And don’t forget: rating scales are your friend — they allow customers to quickly choose a response, rather than writing a detailed answer. They’re also easier to compile and aggregate than freeform answers.
Want to learn more about the customer journey, from brand awareness, to engagement, to conversion? Check out The 2022 Buyer Experience Benchmark Report.
The original version of this page was published at: https://www.invoca.com/blog/12-metrics-you-need-to-measure-brand-awareness
Invoca for Healthcare enables healthcare providers to capture detailed analytics on a new patient’s full journey. This includes the marketing campaign that drove initial interest, the specific webp... Read more